Coal Industry Deep Dive Part 2: A Context for Coal

We’ve already shown that burning coal causes – still – nearly half of the Carbon Dioxide emissions into the atmosphere, and that the costs of coal’s climate harms are 4.6 times the gross revenues for coal sale worldwide. But cities need power and people have to stay warm and fed. Reliable power is important. Today, we look at coal in the context of other sources of power. (For the most part, oil is excluded from this analysis, since only in marginal cases – Alaskan communities, for example - are diesel or other oil forms used to generate electricity: the raw costs are too high, in dollars per megawatt-hour, even without considering carbon emissions and costs.)
We look briefly at three things:
- The current costs of energy derived from multiple sources.
- The long-ish term trends in those costs.
- Comparing the costs of energy from different sources with their carbon footprints.
Throughout, our metric for cost is the Levelized Cost of Energy (LCOE): an estimate of the average net present cost of power generation over the life of a power system. This includes the costs of capital, commissioning (and decommissioning) plants, fuel costs, operating costs, finance costs, and utilization rates. There are multiple sources; here we use mostly Lazard & Co’s 2024 estimate (model 17) but there are other sources.
How much does energy from different sources cost?
Since energy is important to any form of modern life and electricity is energy’s most convenient form, the cost of power generation is a well-studied field, more so as banks and power companies and governments move, too slowly, toward and into clean energy transition. And the complex models looking at LCOE provide ranges for each cost, including factors like plant utilization, interest rates, local operating costs, and so on.
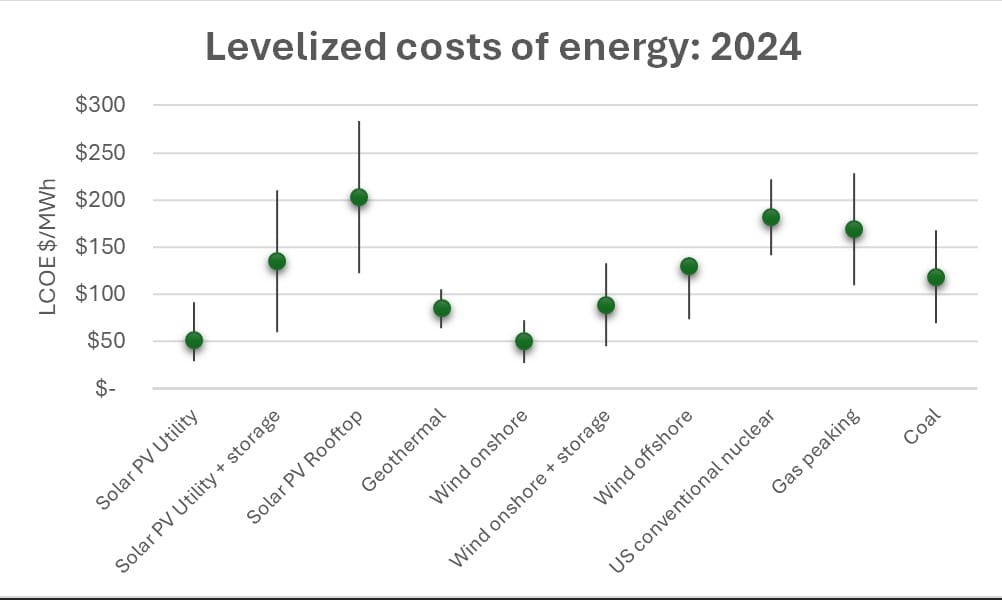
However, as the chart below shows: in 2024 utility-scale solar and onshore wind are the least expensive energy sources – about $50/kWh. This doesn’t include energy storage, needed to provide 24/7 useful power. Adding these takes utility-scale solar to about $135/MWh; onshore wind + storage to about $90. Coal: $118 is already consistently not attractive compared to battery-equipped wind and solar (all data from Lazard LCOE2024, model 17).

What are the long-ish term trends in these costs?
Coal’s been used in home hearths for millennia and the first electrical power plants burnt coal; methane, natural gas started widespread use in power plants in the 1940s. These technologies have long since eked out all important cost gains.
In contrast, photovoltaic solar panels first came into large-scale use after 2008 (and it was some years later that large-scale fabs for polysilicon panels were built in Asia, leveraging their knowhow in flat panel TVs). The impact of semiconductor-process manufacturing, with year-over-year improvements in yield, quality and cost, cannot be understated. Per Jenny Chase of BloombergNEF, solar panels cost $4.20/watt in 2008 ($6 in 2023 costs); in September 2024 they’d dropped to $0.095 (under 10 cents) per watt. Total worldwide installed capacity from solar PV nears 1,000 GW; annual solar module production was set to exceed 400GW in 2023.
Wind turbines have some similar cost advantages – volume production of identical units – that fixed fossil fuel plants, and conventional nuclear reactors cannot have. But wind turbines have production volumes more like large trucks than like consumer semiconductor devices, and they’re obviously less easy to transport and locate. There are about 920,000 wind farms operating worldwide. Wind turbines first emerged in the late 1970s, with individual turbines exceeding 1MW apiece in the early 2000s. The costs of wind-generated energy are dropping but not as fast as solar PV: “the cost of (wind energy dropped) from $0.35/kWh in the 1970s to less than $0.05kWh (by the late 1990s)” and now to $0.033/kWh. That’s a 10-fold decrease but it’s taken decades. Onshore wind costs could decline a further 50% by 2050.
These technologies have decades of cost reductions ahead – along with storage systems, including batteries. One could go further and conjecture that, since the sun will shine in about the current form for a few billion years, and we’ll have tides and winds for longer, the costs of solar, wind and tidal energy should decrease, over and over again, approximately forever.
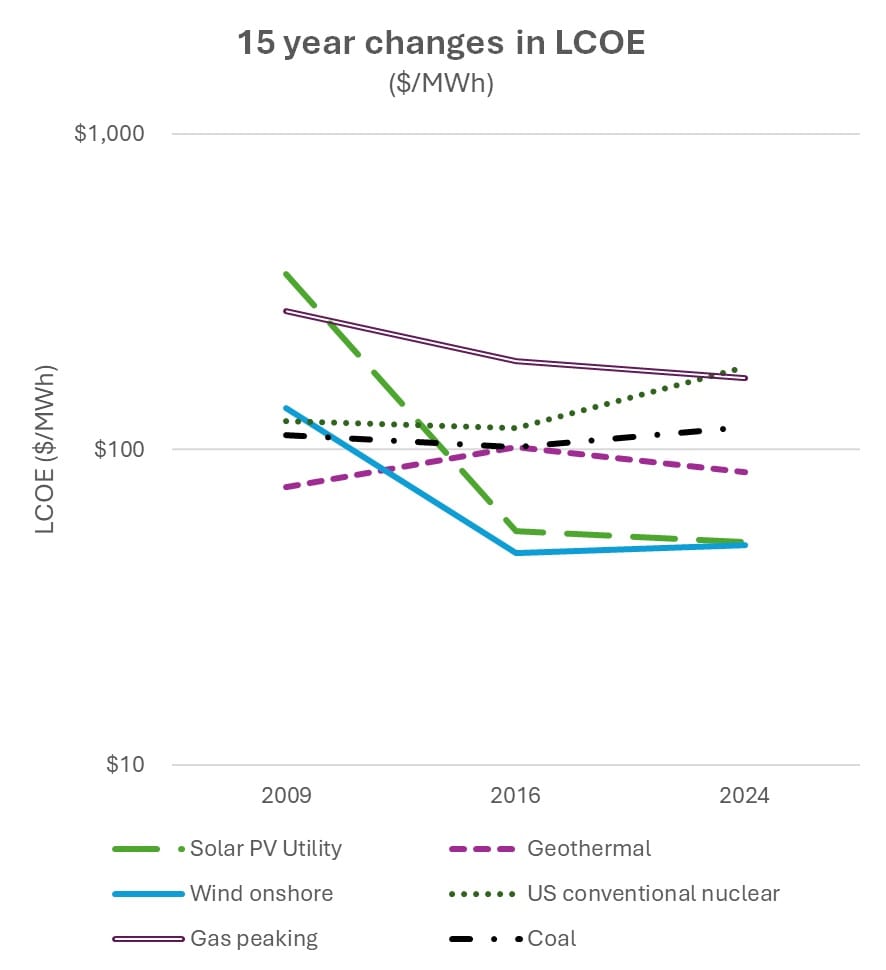
The recent history of LCOEs shows a rapid decline in costs for onshore wind and photovoltaic solar from 2009 (the earliest date in the Lazard model) with costs flat or even rising in the past few years: a consequence of high interest rates driving up the costs of new projects. It is evident that onshore wind and solar (without storage) are far cheaper than alternative sources. (Note that the vertical scale is logarithmic: the 2024 gas peaking plant and conventional nuclear costs are 5 times those of solar or wind. Peaking/peaker plants are built to ramp production up or down quickly; constant-demand plants are less-expensive. Increasingly, gas plants are being used for peaking, with solar and wind plus batteries creating large-scale supply, but still subject to vagaries of weather; nuclear plants provide a steady output, day in and day out, for years; gas fills in the gaps. See for instance: https://www.caiso.com/todays-outlook/supply.)

The true cost of energy
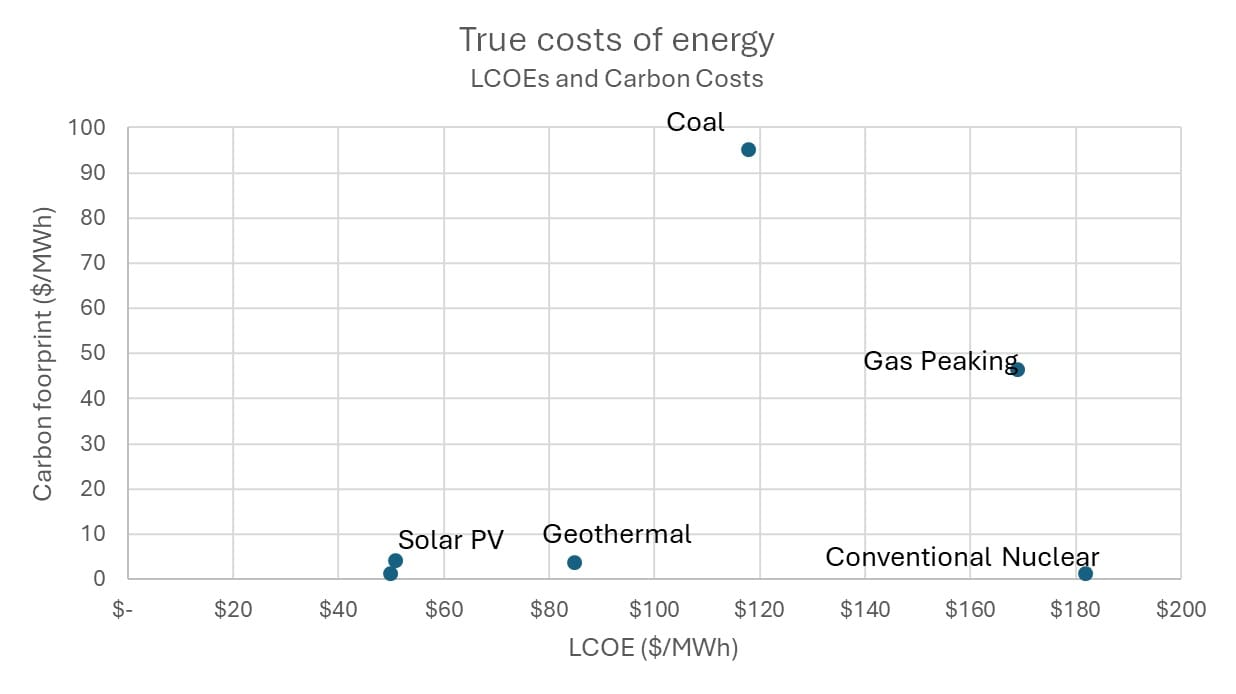
The dilemma, especially for cash-strapped economies, is that the LCOE does not include the costs of climate harms. Yes, the LCOE for coal is higher than for solar or wind – but upfront costs are lower than renewable forms when battery storage costs are added. So: India and China keep building coal plants, even in 2023 and 2024. The chart and table below compare the LCOE for major energy sources, without storage, but including the costs of sequestering carbon emissions.


Here you can see the dilemma: coal is inexpensive, only so long as nobody looks at the carbon footprint. Conventional nuclear power is too expensive in capital and operating costs. But when you consider the carbon costs – and we’ll need to recompute with long-term battery costs as they become available – nuclear is better than gas or coal. And gas is about the same cost as coal, but with lower carbon consequences. Making the right power source choice for a poor or emerging nation will push toward the lower upfront cost; policy and fiscal support is needed to get better global outcomes.
One estimate of the carbon footprint of batteries is 116kg CO2 / MWh for solar PV, and 82kg CO2/MWh for wind. It’s possible to compute from this a range of new costs and outcomes for solar and wind but not within the scope of this short piece. It will make a sizeable difference in carbon footprint for the renewable energy forms.
We’ll update as we get it done.
Comments ()